As Budget time rolls around, we start thinking about the priorities of the Town for the year to come. To frame this thinking, I have used the recently published data from the 2016 Census to give a clearer snapshot of Clarenville. Here's what I found...
pt
The Town of Clarenville is odd - in a good way As most of the Province's town's beyond the isthmus shrink and age at an alarming rate, Clarenville is one of the few towns in Newfoundland and Labrador that continues to grow and whose population median age sits a full four years younger than the provincial median.
The 2016 Statistics Canada Census sheds a beacon on light on Clarenville.
What follows are some of the key findings:
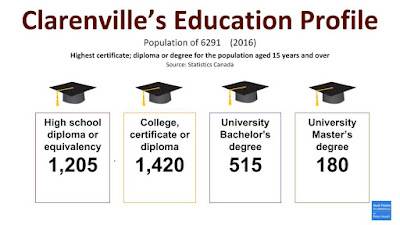
Age/Education - The Median age, the age at which half the population is above, and half below, of NL in 2016 was 46. The major population centres, with the opportunity they provide, tend to attract younger people. Clarenville is one example of one of those opportunity growth centres, as younger working families have moved in, the median age in Clarenville has been kept to about 42 - a full four years younger than the provincial average. The data also shows that Clarenville has a strong pool of skilled labour with the majority of residents with post-secondary education. 58% of the population being of working age and over 65% have earned a post-secondary diploma or degree. People under 20 also outpace people over 65. 24% of the population is less than 20 years old, whereas 18% are over 65.
Clarenville's Age Profile from the 2016 Census.
Clarenville's Education Profile
Income - There are many families in Clarenville whose income is limited. However, there are many more with solid incomes. Median income is $76,000 per household which closely matches the Canadian average but well exceeds the NL average of $67,000 annually.
Clarenville's Income profile - Median income for Clarenville Households of $76,032 in 2015
Clarenville's top occupational areas - Retail and Health Care/Social Services lead the way. The median income for Clarenville Households of $76,032 in 2015
Clarenville's Housing profile. The vast majority of homes are single-detached houses.
Clarenville has been growing - and most people are coming here from other parts of Newfoundland and Labrador. The vast majority of people had been in their current homes for more than a year. The most movement that did happen, was within Clarenville.

Source: https://


Comments
Post a Comment